
Where does the time really go in multi-GPU training?
Published:
When you scale a model across GPUs and throughput goes up, it is tempting to stop there. But “it scaled” and “I know why it scaled” are very different statements - and the gap between them is exactly what fine-grained performance tracing exists to close.
This is a short, honest writeup of one measured finding: scaling DNABERT-2 fine-tuning across 1 → 4 → 8 GPUs with PyTorch DDP, and using Score-P and Vampir to ask where the wall-clock time actually goes - compute, or inter-GPU communication.
(The practical side - eleven errors I hit getting Score-P to trace a DDP run at all - is a separate field guide on dev.to.)
The question
When DNABERT-2 fine-tuning is scaled across GPUs with PyTorch DDP, where does the time go - compute, or inter-GPU communication? And does that balance shift as the GPU count grows?
Method
Each DDP rank was launched under its own Score-P measurement (python -m scorep --cuda), so every worker’s GPU activity - compute kernels and NCCL communication kernels - was captured in a per-rank OTF2 trace. Traces were collected for 1, 4 and 8 GPUs (50 training steps each, CUDA kernel/memcpy/sync tracing enabled) and analysed both as text (scorep-score) and visually in Vampir 10.8.
What the traces show
1. Communication appears only when you scale out. On 1 GPU the trace contains zero NCCL kernels - a clean, communication-free baseline. From 2 GPUs onward, ncclKernel_AllReduce_RING_LL_Sum_float (the gradient synchronisation) appears and grows into the dominant GPU activity.
2. At 8 GPUs, gradient-sync communication costs as much GPU time as the entire backward pass.
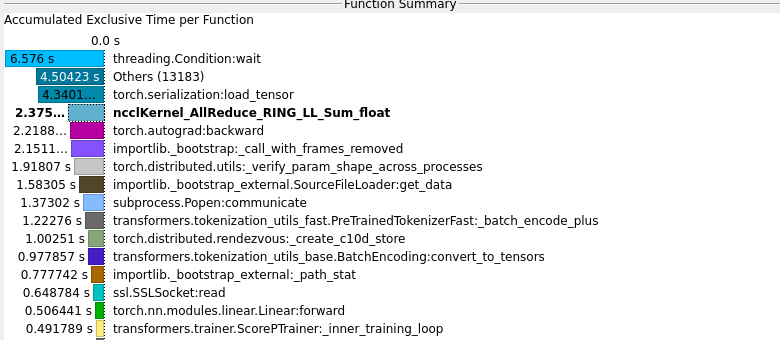
| GPU function | Accumulated time |
|---|---|
ncclKernel_AllReduce_RING_LL_Sum_float (communication) | 2.375 s |
torch.autograd:backward (compute) | 2.22 s |
The single AllReduce kernel is the largest GPU activity in the run - on par with the whole backward pass.
3. …yet that communication is largely hidden, which is why scaling stays efficient.
![Vampir Master Timeline showing two concurrent CUDA streams: compute kernels on the default stream CUDA[0:7] running at the same time as ncclKernel_AllReduce on a separate stream CUDA[0:20]](/images/vampir-overlap-timeline.png)
The Vampir Master Timeline shows two CUDA streams running concurrently: the default stream (CUDA[0:7], CUDA_NULL_STREAM) carrying the forward/backward compute kernels (gemm, attention, element-wise), and a separate stream (CUDA[0:20]) carrying the ncclKernel_AllReduce kernels. The AllReduce blocks sit at the same time positions as the compute kernels: PyTorch DDP overlaps gradient AllReduce with backward computation by placing them on separate CUDA streams.
So although communication is large in kernel-time, much of it is overlapped behind compute and therefore costs little additional wall-clock. This is consistent with the measured end-to-end throughput, which scales near-linearly:
| Config | Samples/sec | Speedup |
|---|---|---|
| 1 GPU | 75.0 | 1× |
| 4 GPU | 345.9 | 4.61× |
| 8 GPU | 680.7 | 9.08× |
The point
A higher-level metric - throughput, or job-level monitoring at ~30 s sampling - can only tell you that scaling is efficient. It cannot show you why. Fine-grained tracing with Score-P localises the cost to a specific kernel (ncclKernel_AllReduce), quantifies it (≈ backward-pass magnitude), and - through the Vampir stream timeline - reveals that it is hidden behind compute. That decomposition is invisible to monitoring and is exactly what trace-based performance analysis exists to provide.
Honest caveats (stated for rigour)
- NCCL’s low-latency (LL) kernels busy-wait on peer flags, so their measured GPU-resident time includes synchronisation wait, not only data transfer - the absolute seconds overstate pure communication.
- Because compute and communication overlap on separate streams, summed kernel-time double-counts the overlapped portion; the exposed (wall-clock) cost is smaller and is what the timeline reveals.
- These are 50-step diagnostic runs on a shared node; absolute kernel times carry contention noise. The robust signals are qualitative and relative: NCCL absent at 1 GPU → dominant by 8 GPUs, overlapped with backward compute.
Traces generated on a SLURM cluster (A100-SXM4-40GB). The companion field guide on making Score-P and PyTorch DDP coexist is on dev.to.